The charts and maps that explain the state of the pandemic in Germany
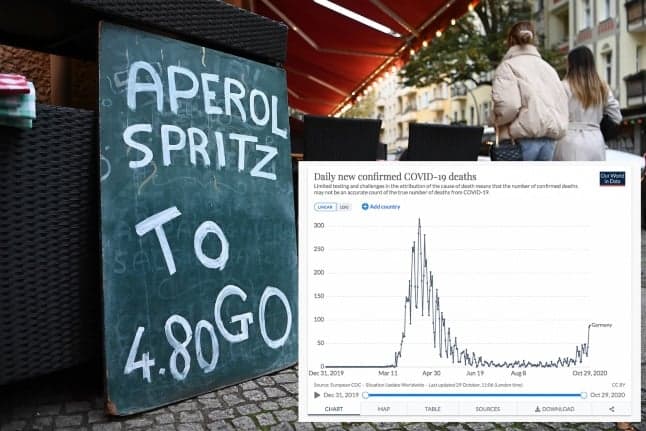
Germany is set to enter a nationwide partial lockdown on Monday to stem the spread of Covid-19. We explain how the situation has been unfolding.
The overall state of play
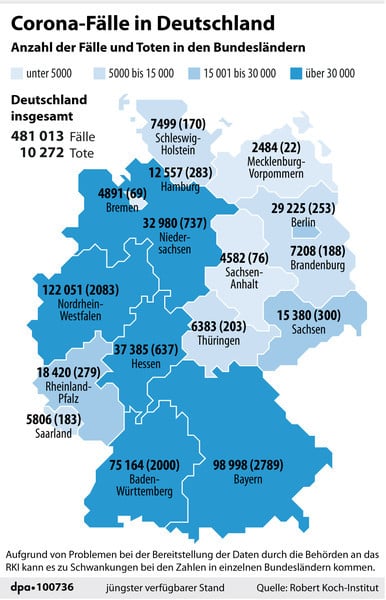
According to official figures, Germany has recorded a total of 481,013 coronavirus cases since the pandemic began (up to October 29th). The below map by DPA shows the total number of cases in each state. Bavaria and the most populous state of North-Rhine Westphalia have registered the most infections.
Number of deaths
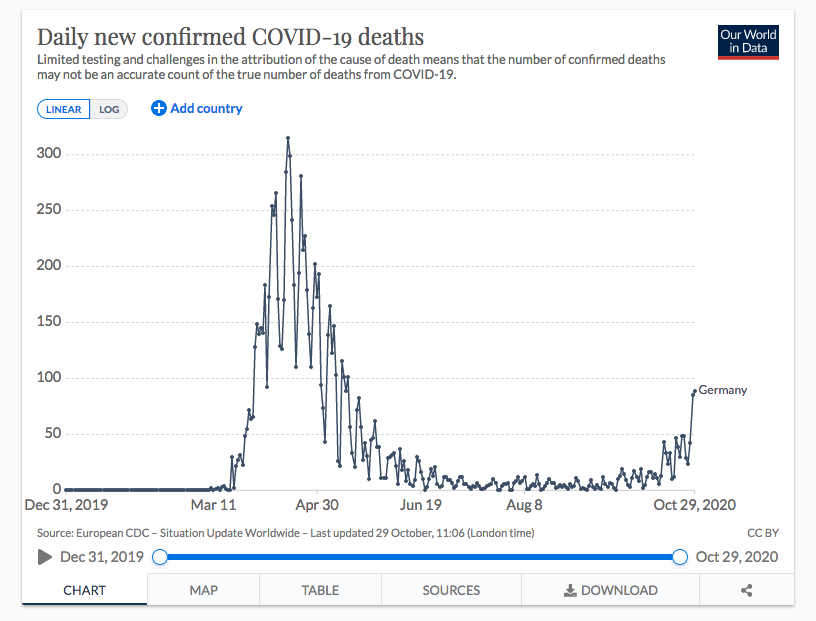
The total number of deaths in Germany up to October 29th is 10,272 according to the Robert Koch Institute (RKI).
This chart below by the European Centre for Disease Prevention and Control, shows the number of daily new deaths linked to Covid-19 in Germany since the pandemic began.
New cases
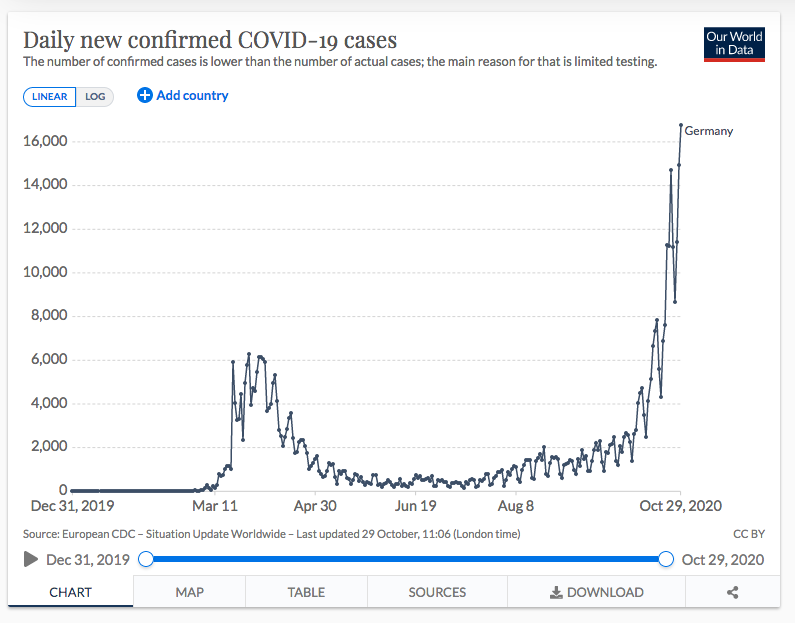
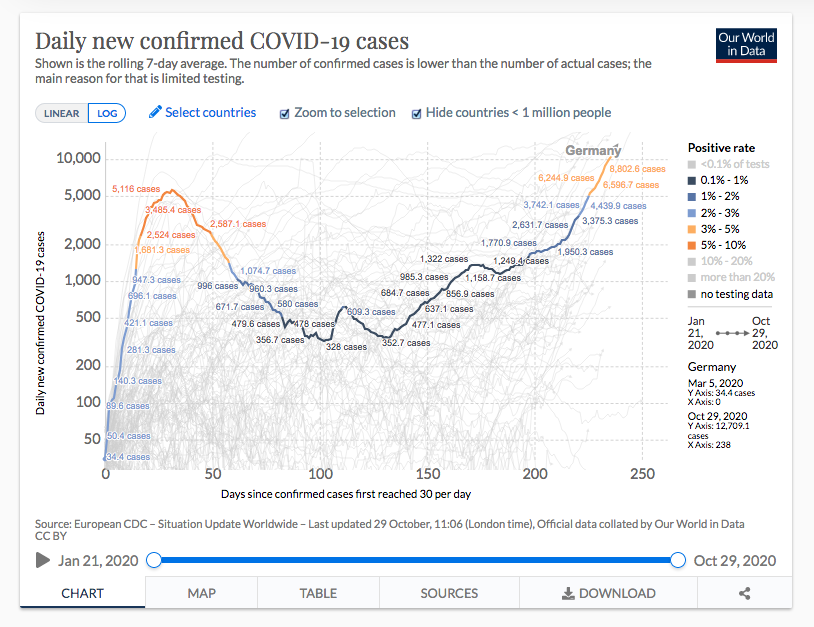
On Thursday October 29th, Germany reported a record 16,774 confirmed coronavirus cases – the highest number since the start of the pandemic. The current figures are only comparable to those from spring to a limited extent, as considerably more tests are now being carried out.
The charts below show daily new confirmed cases, and the seven-day average.
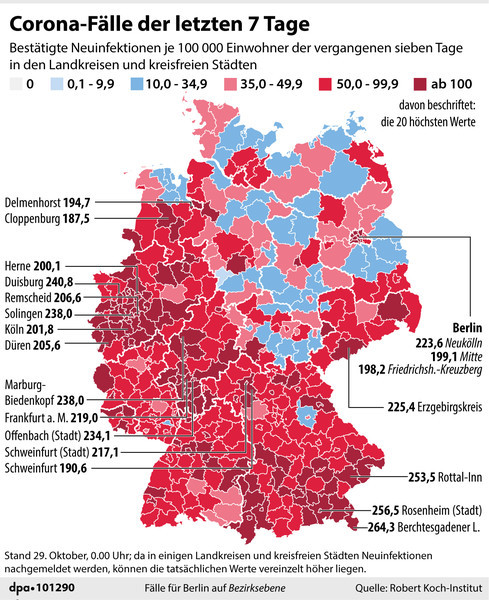
Coronavirus cases in the last seven days per 100,000 residents
The DPA map below shows the number of cases per 100,000 residents in the last seven days (as of October 29th). The areas in red are the worst affected, with blue and pink not as badly hit.
There are currently local lockdowns in Berchtesgadener Land and Rottal-Inn in Bavaria. However, from Monday, across the whole country, even in the less affected zones, there will be a shutdown in place for a month.
READ ALSO:
 Testing
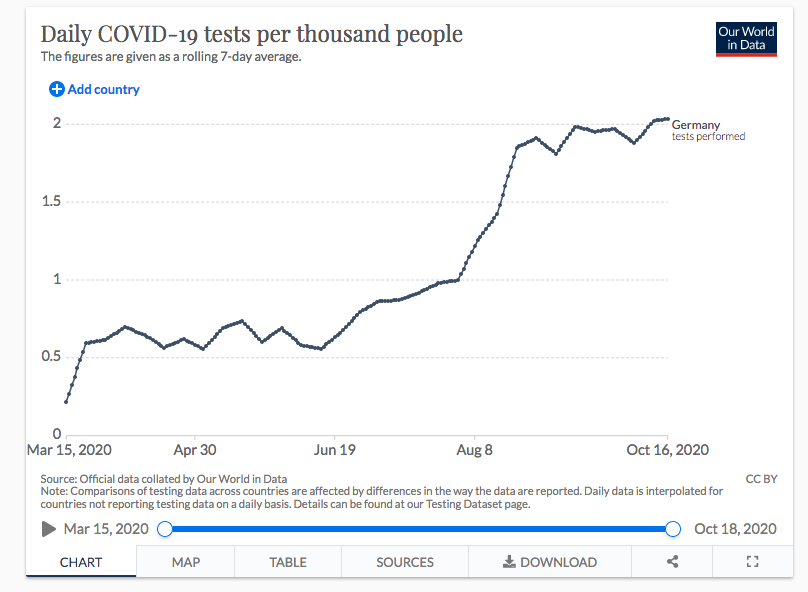
The chart below gives a snapshot showing the number of tests carried out per 1,000 people in Germany since the pandemic began. On October 16th Germany carried out 2.03 tests per 1,000 people. On April 26th that number was 0.62.
How strict has Germany been?
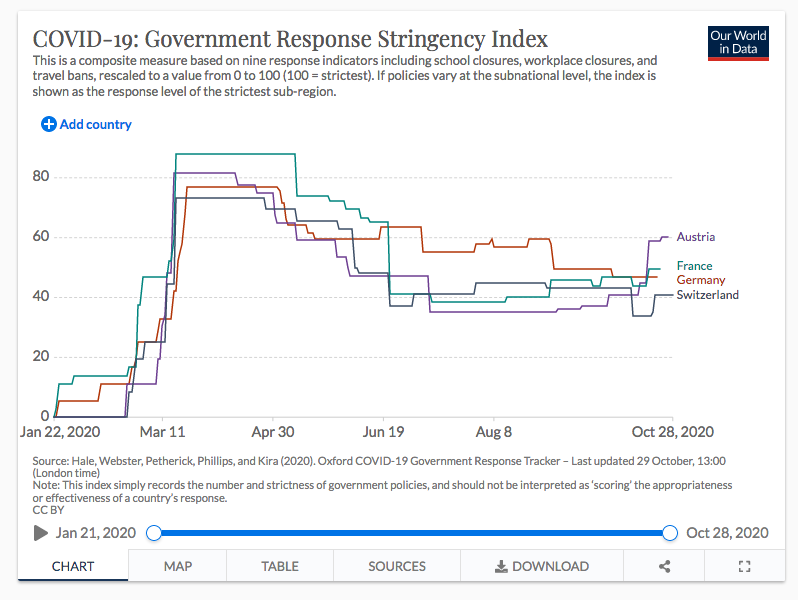
The chart below gives an idea of how strict the Germany government has been in introducing measures aimed to stem the spread of the virus.
It shows how the governmental response has changed over time and the Government Stringency Index – a composite measure of the strictness of policy responses.
The index on any given day is calculated as the mean score of nine policy measures, each taking a value between 0 and 100.
The nine metrics used to calculate the Government Stringency Index are: school closures; workplace closures; cancellation of public events; restrictions on public gatherings; closures of public transport; stay-at-home requirements; public information campaigns; restrictions on internal movements; and international travel controls.
Here the German government reaction is compared to that of neighbours France, Austria and Switzerland.
What's the situation in hospitals?
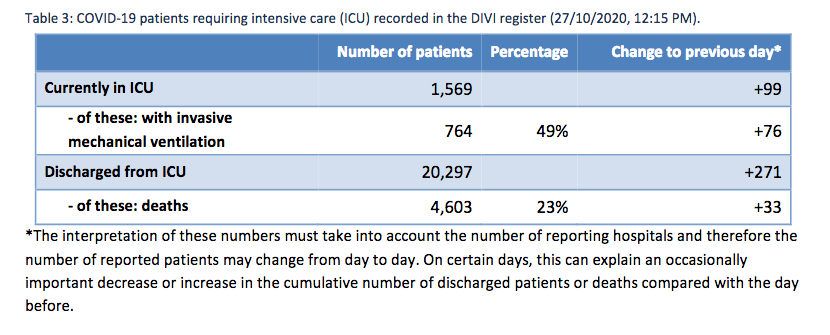
According to the RKI, the number of Covid-19 patients requiring intensive care has more than doubled in the past two weeks from 602 patients on October 14th to 1,569 patients on October 28th, signalling that pressure is increasing on German hospitals.
As of October 28th, a total of 1,285 hospitals or departments reported to the German Interdisciplinary Association for Intensive and Emergency Medicine (DIVI) registry.
Overall, 29,336 intensive care beds were registered, of which 21,790 (74 percent) were occupied, and 7,546 (26 percent) were currently available. The number of Covid-19 cases treated in participating hospitals is shown in the below table by the Robert Koch Institute.
To view more charts, maps and graphs on Germany's Covid-19 situation you can visit Our World in Data.
Comments (4)
See Also
The overall state of play
According to official figures, Germany has recorded a total of 481,013 coronavirus cases since the pandemic began (up to October 29th). The below map by DPA shows the total number of cases in each state. Bavaria and the most populous state of North-Rhine Westphalia have registered the most infections.
Number of deaths
This chart below by the European Centre for Disease Prevention and Control, shows the number of daily new deaths linked to Covid-19 in Germany since the pandemic began.
New cases
On Thursday October 29th, Germany reported a record 16,774 confirmed coronavirus cases – the highest number since the start of the pandemic. The current figures are only comparable to those from spring to a limited extent, as considerably more tests are now being carried out.
The charts below show daily new confirmed cases, and the seven-day average.
READ ALSO:
The chart below gives a snapshot showing the number of tests carried out per 1,000 people in Germany since the pandemic began. On October 16th Germany carried out 2.03 tests per 1,000 people. On April 26th that number was 0.62.
How strict has Germany been?
The chart below gives an idea of how strict the Germany government has been in introducing measures aimed to stem the spread of the virus.
It shows how the governmental response has changed over time and the Government Stringency Index – a composite measure of the strictness of policy responses.
The index on any given day is calculated as the mean score of nine policy measures, each taking a value between 0 and 100.
The nine metrics used to calculate the Government Stringency Index are: school closures; workplace closures; cancellation of public events; restrictions on public gatherings; closures of public transport; stay-at-home requirements; public information campaigns; restrictions on internal movements; and international travel controls.
Here the German government reaction is compared to that of neighbours France, Austria and Switzerland.
What's the situation in hospitals?
According to the RKI, the number of Covid-19 patients requiring intensive care has more than doubled in the past two weeks from 602 patients on October 14th to 1,569 patients on October 28th, signalling that pressure is increasing on German hospitals.
As of October 28th, a total of 1,285 hospitals or departments reported to the German Interdisciplinary Association for Intensive and Emergency Medicine (DIVI) registry.
Overall, 29,336 intensive care beds were registered, of which 21,790 (74 percent) were occupied, and 7,546 (26 percent) were currently available. The number of Covid-19 cases treated in participating hospitals is shown in the below table by the Robert Koch Institute.
To view more charts, maps and graphs on Germany's Covid-19 situation you can visit Our World in Data.
Join the conversation in our comments section below. Share your own views and experience and if you have a question or suggestion for our journalists then email us at [email protected].
Please keep comments civil, constructive and on topic – and make sure to read our terms of use before getting involved.
Please log in here to leave a comment.