In graphs: The stats that shed light on the coronavirus situation in Stockholm
Stockholm health authorities have released new facts and figures showing the impact of the coronavirus, with a breakdown of different age groups.
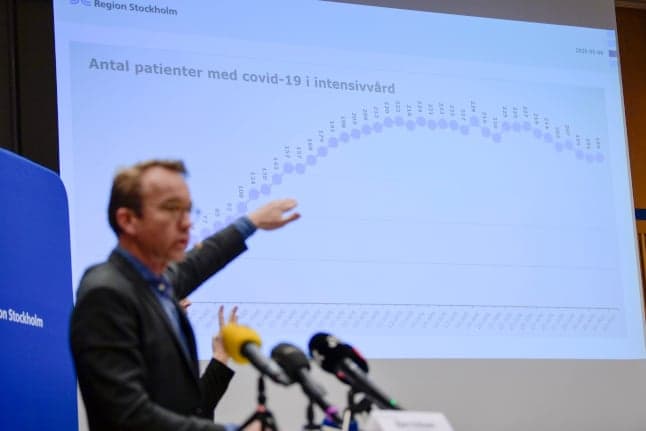
Stockholm health director Björn Eriksson presented new statistics on Monday, showing how the coronavirus affects different age groups and how the outbreak has changed over time in the region, the epicentre of the outbreak in Sweden.
As of May 5th, 8,686 people have tested positive for the coronavirus in Stockholm and 1,524 people have died. The graphs below shed more light on the situation for healthcare in the region.
Eriksson told a press conference on Monday that the number of new deaths linked to the coronavirus in Stockholm is slowly decreasing week-on-week, but the situation remains serious.
"I now turn to all Stockholmers. That we can see a glimmer of light does not mean that we do not need to keep our distance," he said, emphasising that it is more important than ever to follow recommendations. The number of patients discharged from hospital is increasing, but the total number of patients remains high.
"It is necessary that Stockholmers do not accept standing in crowded bars and restaurants, that we do not invite each other over for dinners, that we skip barbecue evenings with friends and most importantly that we do not go to visit family members aged over 70," said Eriksson, adding that it will likely take months before the crisis is over.
Eriksson has previously used the word "storm" to describe the situation in Stockholm healthcare, and he said that even if there were small signs the wind may be subsiding, it was still "at full storm and full wind speed".
All graphs below were produced by Region Stockholm and can also be found here.
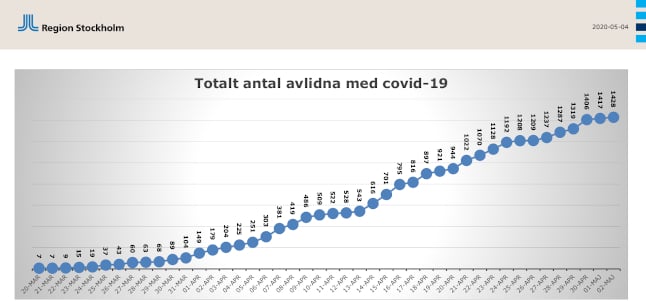
The first graph shows how many people have passed away with the coronavirus. These are the statistics that Stockholm regional health authorities send to Sweden's Public Health Agency, which present the national statistics every day at 2pm. The figures show everyone who died after testing positive for the virus:
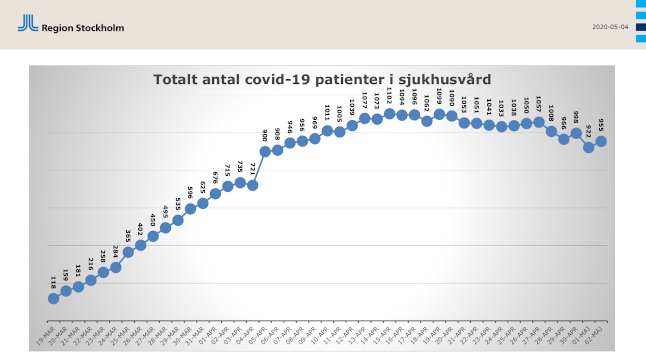
The graph below shows the total number of coronavirus patients in hospital in Stockholm. The number has fallen since a peak around mid-April.
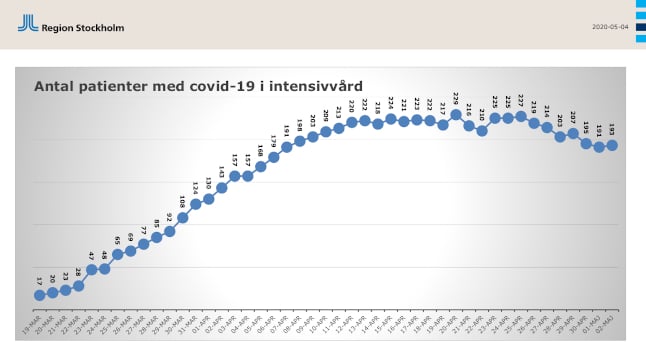
The next graph tells us how many coronavirus patients are currently being treated in intensive care in Stockholm. There are still beds available in intensive care in Stockholm, and a field hospital set up south of the city to accommodate coronavirus patients is ready for use but has yet to open.
But the Swedish healthcare watchdog has launched an investigation into how intensive care is prioritised after reports emerged claiming that some patients in need of intensive care were not receiving it.
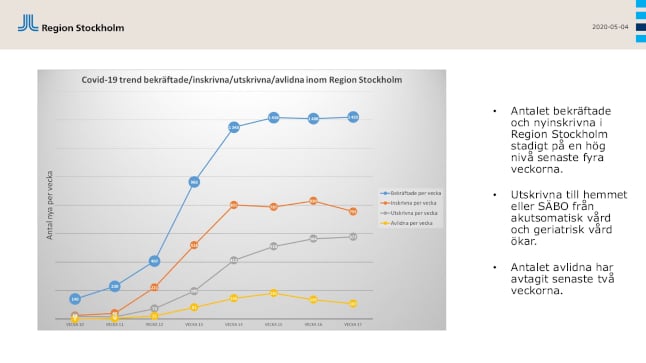
The graphs below show how the number of new coronavirus cases have changed over time. The blue line shows that the number of confirmed new cases per week has been relatively stable for four weeks. The red line shows the number of hospital admissions per week, also relatively stable with a very slight downturn.
The grey line shows how many people have been discharged from hospital every week, which is increasing. The yellow line shows the number of coronavirus-related deaths a week, which is slowly decreasing.
The graphs are dated weekly from the week starting March 2nd to the week ending April 26th.
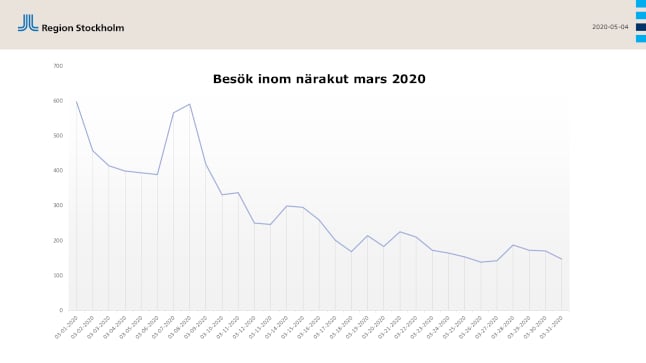
The graph below shows the number of visits made to a närakut in Stockholm in March. Närakut is essentially a walk-in clinic for illnesses or injuries that are too urgent for booking an appointment with a local health centre (vårdcentral) but not so serious that they require a major hospital's accidents and emergency unit.
While it may look good that the number of such visits dropped in March, healthcare authorities point out that it does actually raise serious concerns.
Part of the reason for the decrease may be that people are simply having fewer accidents due to changing lifestyles during the epidemic, but a major concern is that a large part of the reason is in fact that people who would normally seek healthcare aren't doing so at the moment – either for fear of catching the coronavirus, or because they do not want to add more stress for medical staff.
But healthcare authorities are urging people not to refrain from contacting health services if they need care. In Sweden, you should call 112 in case of emergency, and 1177 if you are unwell but do not need urgent help.
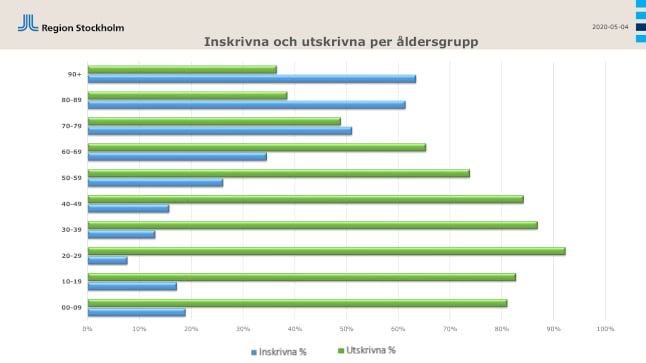
These bars show how many patients in each age group, in percentages, have been admitted (inskrivna, blue bar) to hospital and discharged (utskrivna, green bar). Within each age group, the total of the two bars is 100 percent, so the blue and green bars show the proportion of admissions/discharges within each age group.
As you can see, it varies a lot between age groups, with people over 70 much more likely to be admitted to hospital than younger patients. Health authorities have repeatedly warned that people aged over 70 are far more at risk of developing serious illness than their younger counterparts.
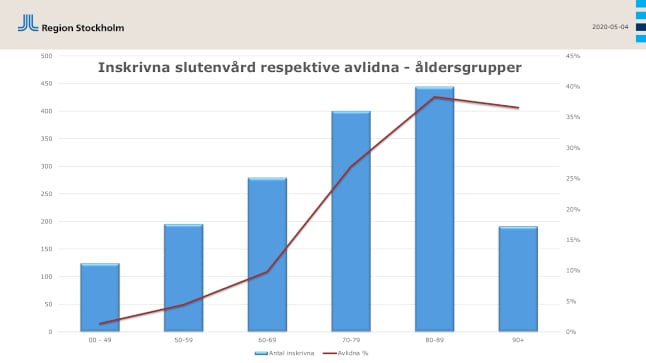
The chart below shows people admitted as inpatients (blue columns, left-hand axis) in each age group, compared to the percentages of how many have passed away (red line, right-hand axis).
Again, it is clear how badly the infection can hit elderly people, with 35-40 percent of inpatients aged over 80 dying with the coronavirus, and around 25 percent of inpatients aged 70-79. That drops to around 10-15 percent of inpatients aged 60-69.
Comments
See Also
Stockholm health director Björn Eriksson presented new statistics on Monday, showing how the coronavirus affects different age groups and how the outbreak has changed over time in the region, the epicentre of the outbreak in Sweden.
As of May 5th, 8,686 people have tested positive for the coronavirus in Stockholm and 1,524 people have died. The graphs below shed more light on the situation for healthcare in the region.
Eriksson told a press conference on Monday that the number of new deaths linked to the coronavirus in Stockholm is slowly decreasing week-on-week, but the situation remains serious.
"I now turn to all Stockholmers. That we can see a glimmer of light does not mean that we do not need to keep our distance," he said, emphasising that it is more important than ever to follow recommendations. The number of patients discharged from hospital is increasing, but the total number of patients remains high.
"It is necessary that Stockholmers do not accept standing in crowded bars and restaurants, that we do not invite each other over for dinners, that we skip barbecue evenings with friends and most importantly that we do not go to visit family members aged over 70," said Eriksson, adding that it will likely take months before the crisis is over.
Eriksson has previously used the word "storm" to describe the situation in Stockholm healthcare, and he said that even if there were small signs the wind may be subsiding, it was still "at full storm and full wind speed".
All graphs below were produced by Region Stockholm and can also be found here.
The first graph shows how many people have passed away with the coronavirus. These are the statistics that Stockholm regional health authorities send to Sweden's Public Health Agency, which present the national statistics every day at 2pm. The figures show everyone who died after testing positive for the virus:
The graph below shows the total number of coronavirus patients in hospital in Stockholm. The number has fallen since a peak around mid-April.
The next graph tells us how many coronavirus patients are currently being treated in intensive care in Stockholm. There are still beds available in intensive care in Stockholm, and a field hospital set up south of the city to accommodate coronavirus patients is ready for use but has yet to open.
But the Swedish healthcare watchdog has launched an investigation into how intensive care is prioritised after reports emerged claiming that some patients in need of intensive care were not receiving it.
The graphs below show how the number of new coronavirus cases have changed over time. The blue line shows that the number of confirmed new cases per week has been relatively stable for four weeks. The red line shows the number of hospital admissions per week, also relatively stable with a very slight downturn.
The grey line shows how many people have been discharged from hospital every week, which is increasing. The yellow line shows the number of coronavirus-related deaths a week, which is slowly decreasing.
The graphs are dated weekly from the week starting March 2nd to the week ending April 26th.
The graph below shows the number of visits made to a närakut in Stockholm in March. Närakut is essentially a walk-in clinic for illnesses or injuries that are too urgent for booking an appointment with a local health centre (vårdcentral) but not so serious that they require a major hospital's accidents and emergency unit.
While it may look good that the number of such visits dropped in March, healthcare authorities point out that it does actually raise serious concerns.
Part of the reason for the decrease may be that people are simply having fewer accidents due to changing lifestyles during the epidemic, but a major concern is that a large part of the reason is in fact that people who would normally seek healthcare aren't doing so at the moment – either for fear of catching the coronavirus, or because they do not want to add more stress for medical staff.
But healthcare authorities are urging people not to refrain from contacting health services if they need care. In Sweden, you should call 112 in case of emergency, and 1177 if you are unwell but do not need urgent help.
These bars show how many patients in each age group, in percentages, have been admitted (inskrivna, blue bar) to hospital and discharged (utskrivna, green bar). Within each age group, the total of the two bars is 100 percent, so the blue and green bars show the proportion of admissions/discharges within each age group.
As you can see, it varies a lot between age groups, with people over 70 much more likely to be admitted to hospital than younger patients. Health authorities have repeatedly warned that people aged over 70 are far more at risk of developing serious illness than their younger counterparts.
The chart below shows people admitted as inpatients (blue columns, left-hand axis) in each age group, compared to the percentages of how many have passed away (red line, right-hand axis).
Again, it is clear how badly the infection can hit elderly people, with 35-40 percent of inpatients aged over 80 dying with the coronavirus, and around 25 percent of inpatients aged 70-79. That drops to around 10-15 percent of inpatients aged 60-69.
Join the conversation in our comments section below. Share your own views and experience and if you have a question or suggestion for our journalists then email us at [email protected].
Please keep comments civil, constructive and on topic – and make sure to read our terms of use before getting involved.
Please log in here to leave a comment.